Solana/Economic System/Genesis Block (Part 2)
We use the following code to summarize the balances of all accounts in the genesis block, finding that the initial total issuance of SOL in the genesis block was 500000000 SOL.
import json
import pathlib
import pxsol

genesis = json.loads(pathlib.Path('genesis.json').read_text())
accounts = genesis['accounts']

lamports = sum([e['account']['lamports'] for e in accounts])
print(lamports / pxsol.denomination.sol) # 500000000.0
Next, we queried the total supply of SOL on that day through solscan.io. As of September 2, 2025, the total supply of SOL was 608,757,550 tokens (including 540,915,225 in circulating supply and non-circulating supply). This means that after 5.5 years of operation, the vast majority of SOL in circulation (500,000,000 / 540,915,225 = 92.4%) still originates from the genesis block. From this information, we can derive at least two useful analyses:
- Nearly all SOL currently in circulation comes from the sell-offs of the 431 genesis block accounts.
- The inflation rate is extremely low. Using the formula
(540915225 / 500000000) ** (1 / 5.5), we calculate the actual annual inflation rate to be 1.44%.
There has been some criticism in the Solana community that Solana's initial distribution was quite concentrated, with early investors and the team holding the vast majority of tokens. Let's use code to verify whether this claim is accurate.
import json
import pathlib

genesis = json.loads(pathlib.Path('genesis.json').read_text())
accounts = genesis['accounts']
accounts.sort(key=lambda x: -x['account']['lamports'])

lamports_total = sum([e['account']['lamports'] for e in accounts])
lamports_top10 = sum([e['account']['lamports'] for e in accounts[:10]])
lamports_top20 = sum([e['account']['lamports'] for e in accounts[:20]])
lamports_top50 = sum([e['account']['lamports'] for e in accounts[:50]])

print(lamports_top10 / lamports_total) # 0.87
print(lamports_top20 / lamports_total) # 0.92
print(lamports_top50 / lamports_total) # 0.94
The analysis results are as follows:
- The top 10 addresses in the genesis block hold 87% of the total initial distribution.
- The top 20 addresses in the genesis block hold 92% of the total initial distribution.
- The top 50 addresses in the genesis block hold 94% of the total initial distribution.
It appears that the community criticism is quite reasonable. Here are the blockchain explorer links for the top 10 addresses. We believe these addresses should mostly belong to real-world venture capital firms and the Solana Foundation/developer team, but this article does not intend to actually analyze the real-world entities behind these accounts, so we simply list them here.
- https://solscan.io/account/APnSR52EC1eH676m7qTBHUJ1nrGpHYpV7XKPxgRDD8gX
- https://solscan.io/account/13LeFbG6m2EP1fqCj9k66fcXsoTHMMtgr7c78AivUrYD
- https://solscan.io/account/GK2zqSsXLA2rwVZk347RYhh6jJpRsCA69FjLW93ZGi3B
- https://solscan.io/account/8HVqyX9jebh31Q9Hp8t5sMVJs665979ZeEr3eCfzitUe
- https://solscan.io/account/HbZ5FfmKWNHC7uwk6TF1hVi6TCs7dtYfdjEcuPGgzFAg
- https://solscan.io/account/14FUT96s9swbmH7ZjpDvfEDywnAYy9zaNhv4xvezySGu
- https://solscan.io/account/9huDUZfxoJ7wGMTffUE7vh1xePqef7gyrLJu9NApncqA
- https://solscan.io/account/C7C8odR8oashR5Feyrq2tJKaXL18id1dSj2zbkDGL2C2
- https://solscan.io/account/AYgECURrvuX6GtFe4tX7aAj87Xc5r5Znx96ntNk1nCv
- https://solscan.io/account/AogcwQ1ubM76EPMhSD5cw1ES4W5econvQCFmBL6nTW1
Finally, we create a pie chart to visually display the proportion of shares held by each address in the genesis block.
import json
import matplotlib.pyplot as plt
import pathlib

plt.style.use('seaborn-v0_8-darkgrid')
plt.figure(figsize=(4.8, 2.7))

genesis = json.loads(pathlib.Path('genesis.json').read_text())
accounts = genesis['accounts']
accounts.sort(key=lambda x: -x['account']['lamports'])

x = [e['account']['lamports'] for e in accounts]

plt.pie(x)
plt.axis('equal')
plt.show()
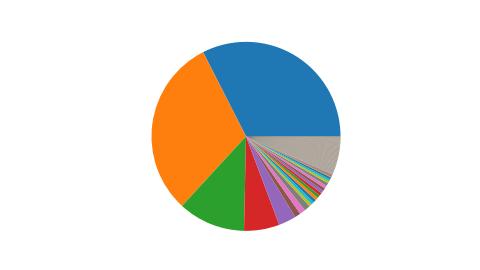
Note that the gray area in the above chart represents the aggregated display of hundreds of lower-ranked accounts, not a single account.